Observability
Ella Core supports four observability pillars: Metrics, Logs, Traces, and Profiles.
Metrics
Ella Core exposes a set of Prometheus metrics to monitor the health of the system and the performance of the network.
Default Go metrics
These metrics are used to monitor the performance of the Go runtime and garbage collector. These metrics start with the go_ prefix.
Custom metrics
These metrics are used to monitor the health of the system and the performance of the network. These metrics start with the app_ prefix. The following custom metrics are exposed by Ella Core:
app_database_storage_bytes: The total storage used by the database in bytes. This is the size of the database file on disk.app_ip_addresses_allocated_total: The total number of IP addresses currently allocated to subscribers.app_ip_addresses_total: The total number of IP addresses available for subscribers.app_pdu_sessions_total: Number of PDU sessions currently in Ella Core.app_uplink_bytes: The total number of bytes transmitted in the uplink direction (N3 -> N6). This value includes the Ethernet header.app_downlink_bytes: The total number of bytes transmitted in the downlink direction (N6 -> N3). This value includes the Ethernet header.app_xdp_action_total: The total number of packets, with labels for the interface (n3, n6), and action taken.
API
Please refer to the metrics API documentation for more information on accessing metrics in Ella Core.
Logs
Ella Core produces two types of logs: system logs and audit logs.
Ella Core does not assist with log rotation; we recommend using a log rotation tool to manage log files.
System Logs
Ella Core logs many events, including errors, warnings, and information messages. The logs help monitor the health of the system and diagnose issues. Users can configure the log level and output (stdout or file) for system logs.
Audit Logs
Ella Core automatically logs all user actions, including login attempts, API calls, and changes to the system configuration. Users can configure the output (stdout or file) for audit logs.
In addition to the output defined via the configuration file, audit Logs are accessible via the API and the Web UI.
Example
In the following example, we see the [email protected] user creating a policy named new-policy with the associated timestamp.
2025-03-01T09:47:59.410-0500 INFO logger/logger.go:214 audit event {"component": "Audit", "action": "create_policy", "actor": "[email protected]", "details": "User created policy: new-policy", "ip": "127.0.0.1"}
Configuration
For more information on configuring logging in Ella Core, refer to the Configuration File documentation.
Traces
Ella Core supports tracing using OpenTelemetry. This allows users to collect and export traces from Ella Core to a tracing backend for analysis and visualization.
Traces are collected for the following root components:
API
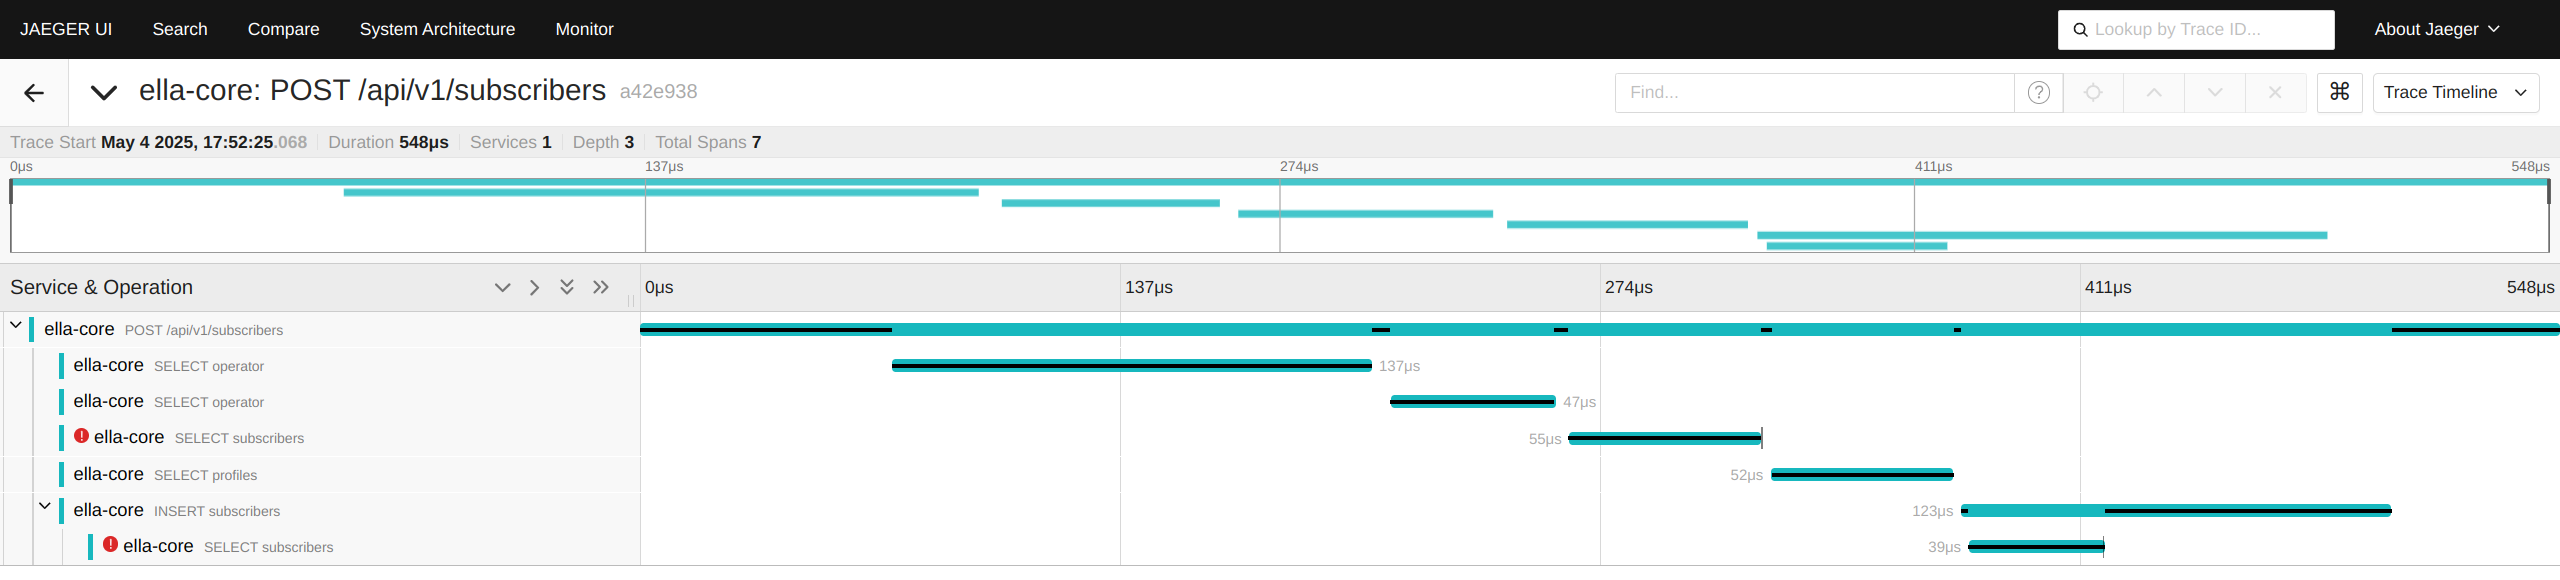
Each API call made to Ella Core is traced, allowing users to monitor and analyze the performance of API requests. Each trace includes information about the request, such as the endpoint, method, and response time. Spans may also include database operations.
NGAP
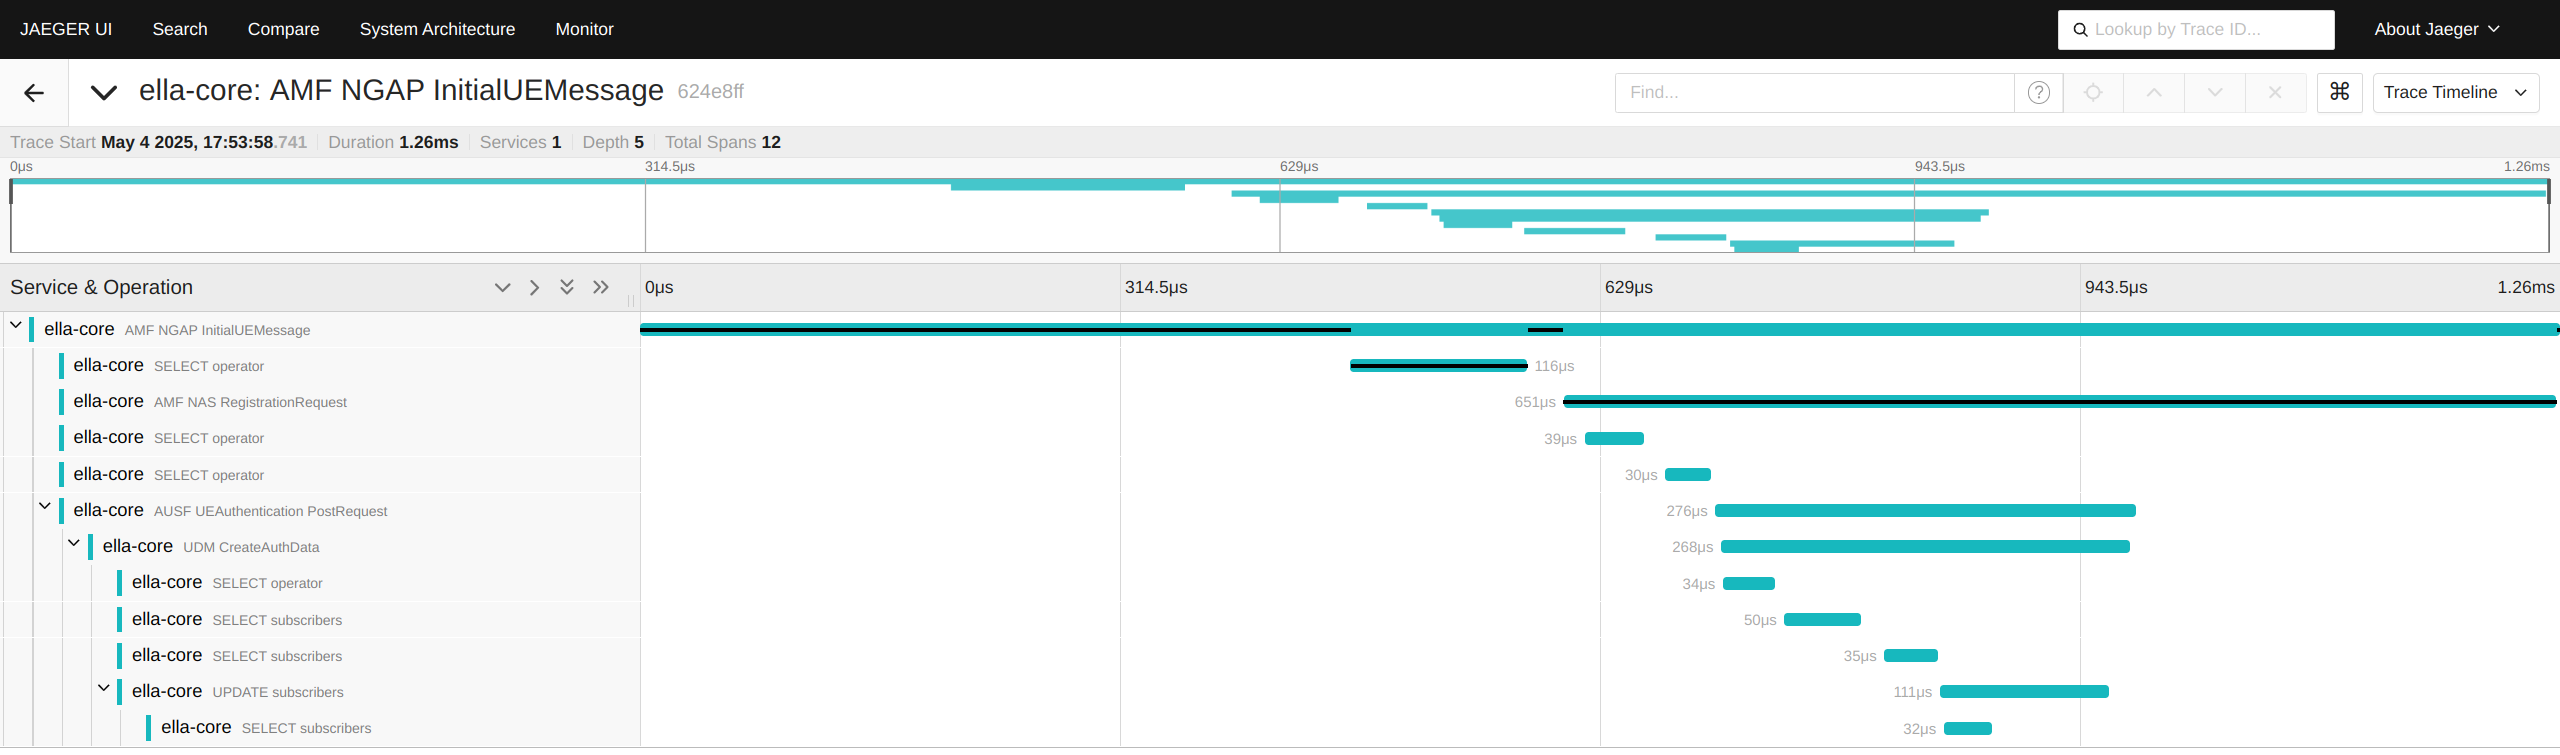
Ella Core's NGAP interface is traced, allowing users to monitor and analyze the performance of NGAP messages. Each trace includes information about the message type, source, destination, and response time. Spans may also include database operations, NAS messages, and internal Network Function calls.
Configuration
For more information on configuring tracing in Ella Core, refer to the Configuration File documentation.
Profiles
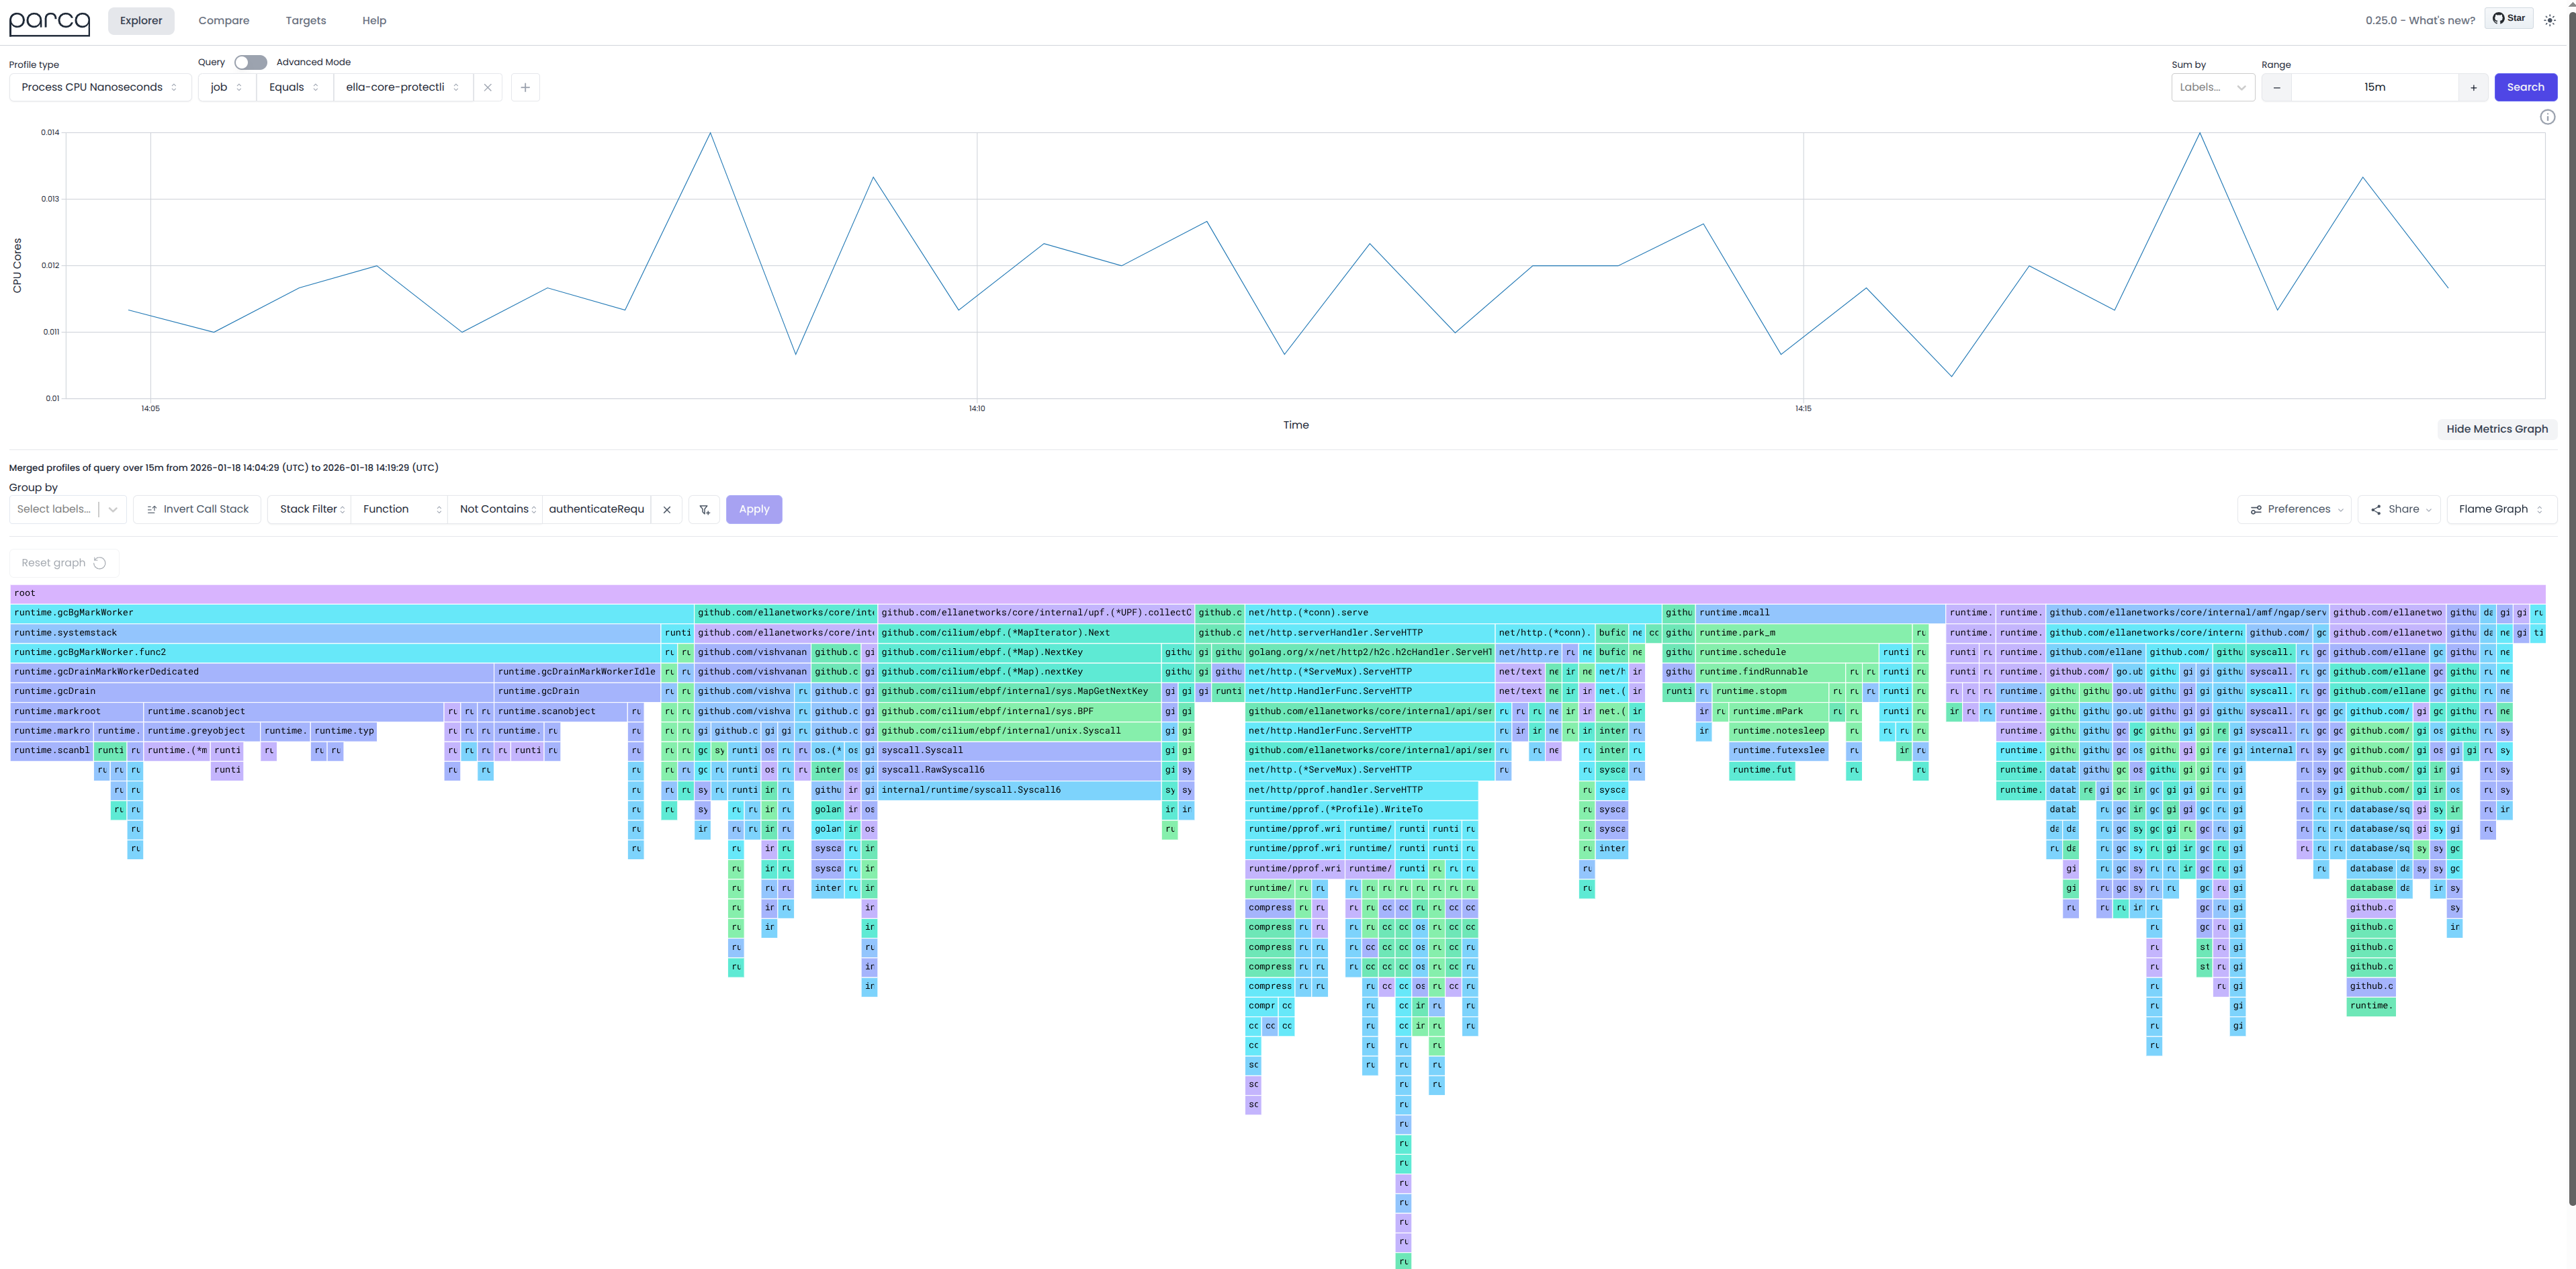
Ella Core exposes the http/pprof API for CPU and memory profiling analysis. This allows users to collect and analyze profiles of Ella Core using visualization tools like pprof or parca.
API
For more information on accessing the pprof API in Ella Core, refer to the pprof API documentation.